Listening and questioning do involve imagination to some extent, but when your investigations are finished and you’ve got most of the facts in front of you, imagination takes over and you must use it to analyse and structure your facts usefully. Writing things down, representing things diagrammatically, and explaining things involves thought, choice and creativity.
How to do it in a way that lays the issues bare in the right kind of way? The ‘right kind of way’, of course, reflects your theory about the facts and the solution you want to put forward.
Representing what we’ve understood is an essential step in the consulting process. We do it in order to articulate and obtain confirmation of our findings and to advance our own view of them, what they mean, and what should be done about them. The very act of analysing will often deliver a solution to us. This is the Sherlock Holmes part of the process – seeing a coherent explanation in a mess of disparate clues.
When I run my training course on Non-Technical Skills for Consultants I ask participants to ‘structure’ the information contained in a rather undisciplined stream of thought. I ask them to imagine someone considering a trip from the UK to Italy. The consultant’s role is to lay out the options in a way that helps this traveller to decide how to travel.
“I hate flying, but there’s a flight that leaves on Saturday morning via Paris. Even with the connection it only takes three hours. Or I could drive, but at this time of year you can’t trust the mountain passes, even if this is the cheapest way. The train goes directly to the town, and the church isn’t far from the station. Trains are always the most relaxing, even if they’re very expensive these days. I could even have dinner and get a good night’s sleep. The trouble with the flight is that it arrives only half an hour before the wedding starts and I can’t risk not getting there. I can’t understand why my friends chose a tiny town near Rome for their wedding. And if my Mother comes too, it’s going to cost an awful lot unless I go by car. Why did they ask me to be a witness?”
The first step is to tease out the facts relevant to the issue at stake. These are:, in the sequence in which they are expressed:
- The traveller hates flying
- The flight will take only three hours
- Driving is the cheapest form of travel
- The mountain passes are unreliable at this time of year
- Travelling by train would be the most restful
- Travelling by train would be very expensive
- The flight may not get the traveller to his or her destination in time
- The traveller may travel with his or her mother
- Costs are in proportion to the number of travellers except in the case of travelling by car
How should such information be represented?
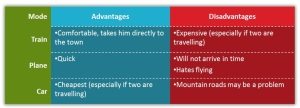
One way might be this way:
These colourful diagrams sort out the advantages and disadvantages and lay them out against the three modes of transport. It’s logically correct but not persuasive because its primary structure (separating advantages and disadvantages) doesn’t reflect the way we think, the process of decision between modes of transport involving immediate comparison of advantage and disadvantage.
This one is better:
This one better still, because it enables comparison more easily.
But none of the above provides a very deep analysis of the issue. They simply lay out the facts as divulged. Better, perhaps, to group each ‘determinant’ by ‘category’ – such as speed, comfort, cost, and risk. This involves deeper judgement as to what matters when a traveller must make a decision.
It’s more helpful because it enables us to ask the traveller, ‘What matters more to you? Is it comfort, or speed, or cost or risk?’ It lays bare the fact that we must first decide what matters most before a decision can be made.
You might even go a stage further and develop an ‘algorithmic’ way of representing the data so that a decision can be derived from the way the data are represented.
Supposing we assign the following weightings to these four categories:
- Speed – 6
- Comfort – 7
- Cost – 8
- Risk – 8
We show the data for the two different situations – with mother and without – and the diagrams deliver a decision for us, which is Train in both cases.
Of course the result would be different according to how you weight the categories.
I find the discipline of describing and representing a problem the most important step in terms of coming up with a solution. I try one way and find that the facts don’t fit, or that there’s something awkward in the way I’ve chosen to describe things, and then I try another until I arrive at the right way. And if I’m lucky a solution tumbles out.
See also:
The Art of Consulting – What’s the Role of the Consultant?
The Art of Consulting – Impartial, Honest and Independent
The Art of Consulting – The Essential Skills


The Art of Consulting – Writing Simply – Adam Bager
The Art of Consulting – Designing (Completeness & Simplicity) – Adam Bager
The Art of Consulting – Designing (Pragmatism) – Adam Bager
The Art of Consulting – Designing (Affordability, Flexibility, Maintainability, Elegance) – Adam Bager
The Art of Consulting – Judgement – Adam Bager
The Art of Consulting – Presenting – Adam Bager
The Art of Consulting – The Final Report – Adam Bager
The Art of Consulting – Persuading – Adam Bager
The Art of Consulting – Planning – Adam Bager
The Art of Consulting – Managing Others – Adam Bager
The Art of Consulting – Clients – Adam Bager
The Art of Consulting – Selling – Adam Bager
The Art of Consulting – Some Golden Rules – Adam Bager